If you run brand partnerships, your UGC budget line was probably built from a rate card, and rate cards are asking prices, not clearing prices. The real 2026 deal data tells a different story: the median paid UGC post is $200, and roughly two-thirds of deals close under $500, far below the four-figure anchors most published guides put in front of you. Budget off what actually clears, and you can build accurate, vertical-specific line items and negotiate from evidence instead of a number a creator’s coach told them to ask for.
Your UGC Budget Line Is Probably Based on the Wrong Number
Most brand-side UGC budgets are anchored to published rate cards, which document what creators want to charge, not what deals actually close at. In the real 2026 data, the all-industry median paid UGC deal is $200 with a p25 to p75 band of $60 to $1,000 (Creatorland, 2026), while the rate-card guides that dominate search results routinely open with four-figure anchors.
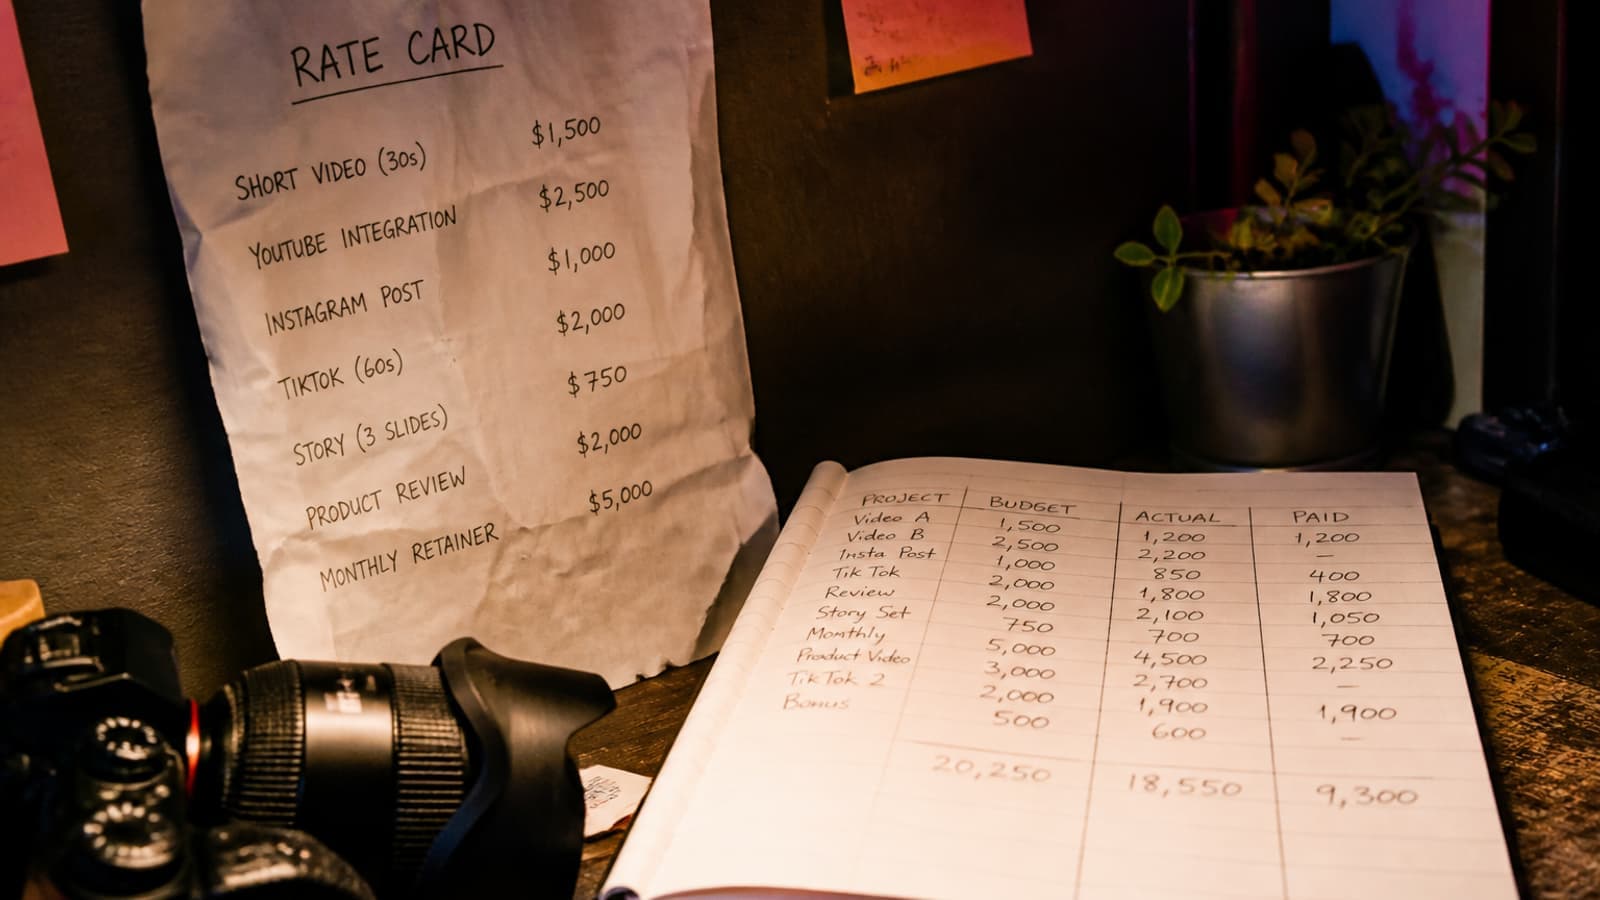
That gap is not a rounding error, it is the whole problem. A rate card is a negotiating tool built for the creator’s side of the table: it lists the highest defensible ask across usage rights, exclusivity, and content type, then leaves you to talk it down. When your finance team sets a per-post line item off that number, you either overpay by default or you kill deals that would have closed at half the quoted rate. Neither outcome is a budget, it is a guess dressed up as one.
What 11,130 Real Deals Say About Actual UGC Spend
The clearest picture of real UGC spend comes from closed-deal data, not asking prices: across 92,879 deals tracked in 2026 year to date, 11,130 deals across 4,012 brands carry an actual dollar value, and the all-industry median lands at $200 (Creatorland, 2026). About two-thirds of those valued deals close under $500.
That distribution is the number your budget should start from. The p25 to p75 band of $60 to $1,000 tells you the honest working range for a single UGC deliverable, and it is nowhere near the $1,500 to $5,000 anchors that generic rate cards publish as “standard.” When you set your per-asset line at $200 to $500 and treat anything above $1,000 as a premium tier that needs justifying, you are budgeting off the same evidence a creator would see if they benchmarked their own quote against the market.
The reason this matters now: the supply of UGC creators surged roughly 93% year over year (Industry reporting, 2025), which means more people quoting rates and more variance in what those rates mean. The published cards are getting louder, not more accurate.
Why Gaming, Food, and Travel Pay 3 to 4x More Than Fashion or Tech
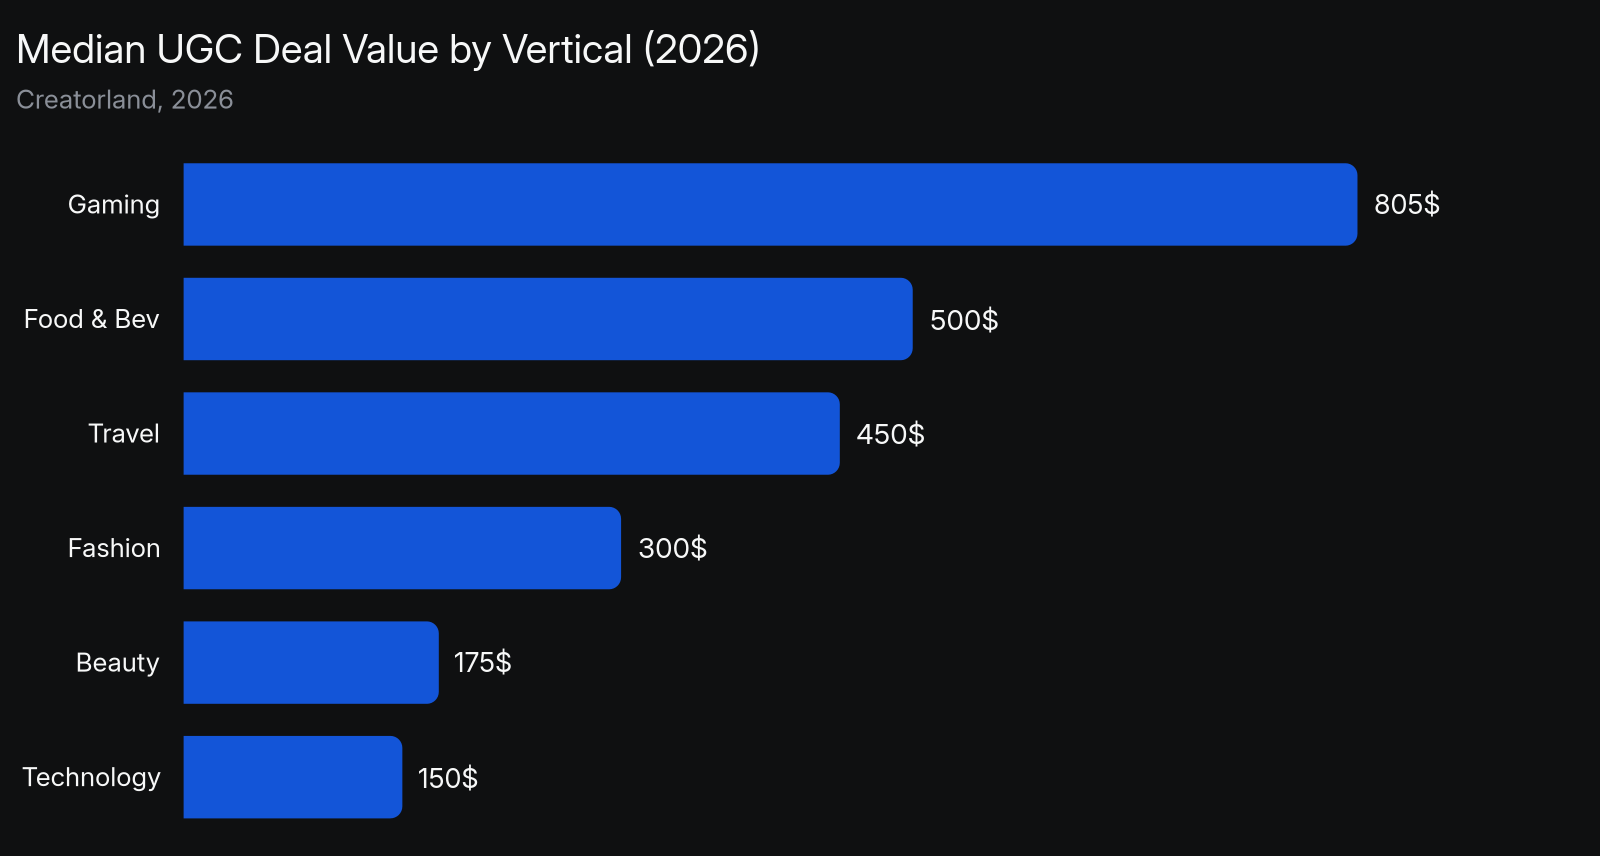
Vertical is the single biggest driver of what a UGC deal actually costs, and the spread is wide: gaming carries a $805 median with a $4,750 p75, while technology sits at a $150 median across 2,551 valued deals (Creatorland, 2026). Budgeting one flat “UGC rate” across categories is the fastest way to be wrong in both directions.
The pattern holds across the data. Food and beverage runs a $500 median with a $2,000 p75, travel and hospitality a $450 median with a $2,000 p75, and fashion a $300 median with a $1,500 p75. Beauty, one of the highest-volume categories, sits low at a $175 median across 1,646 valued deals. High-production or high-consideration categories pay up; high-volume, high-supply categories like beauty and tech pay down.
If you run creator marketing for a beauty or tech brand, this is good news: your category clears low because the deal volume is enormous. If you are in gaming or food, budget for the premium and stop benchmarking against a generic card that averages every vertical into one misleading number.
TikTok vs Instagram: Where the Deal Volume (and the Money) Actually Sits
Platform mix should shape your budget because the two dominant UGC platforms carry very different deal volumes. TikTok accounts for 3,916 brands and 15,568 deals in the 2026 data, more than double Instagram’s 3,234 brands and 7,161 deals (Creatorland, 2026). That volume gap tells you where the market is liquid and where you have negotiating use.
More volume on TikTok means more comparable deals to anchor against, more creators competing for the same brief, and a tighter, more defensible clearing price. Instagram carries fewer deals but often skews toward higher-production lifestyle and visual-commerce content, which is part of why it commands its own pricing dynamic. When you split a campaign budget, treat TikTok as the higher-liquidity, more benchmarkable line and Instagram as the tier where you pay for production and audience fit.
The deal-type mix matters too. Brand collaborations show up across 2,034 brands and product seeding across 1,647 brands (Creatorland, 2026), and seeding deals clear far lower than paid collaborations. If your program leans on seeding, your effective per-creator cost drops well below the paid-post median, and your budget should reflect that instead of pricing every touch as a full paid deliverable.
How to Build a Defensible Per-Vertical Budget Line, Not a Guess
A defensible UGC budget starts from the median clearing price in your specific vertical, then layers premiums for platform, usage rights, and production, rather than starting from a rate card’s ceiling. Anchor each line to a real median: $200 all-industry, or your category’s number when you have it (Creatorland, 2026).
Here is the working sequence.
- Start with the vertical median. Beauty at $175, fashion at $300, food and beverage at $500, gaming at $805. This is your base per-asset line, not your maximum.
- Set the working band, not a single number. Budget the p25 to p75 range ($60 to $1,000 all-industry) so finance sees a floor and a ceiling instead of one figure that breaks the moment a deal comes in high or low.
- Separate seeding from paid. Product seeding clears far below paid collaboration. If half your program is seeding, your blended per-creator cost is well under the paid median.
- Add premiums only where they are earned. Usage rights, exclusivity, and whitelisting are real cost drivers, but they are line items on top of the base, not baked into a single inflated “rate.”
- Weight your platform mix. More budget flows to your higher-volume platform because that is where you have the most comparable deals and the most use.
Two-thirds of valued deals in the data close under $500 (Creatorland, 2026). A budget that treats $500 as a typical ceiling for a standard deliverable, with premiums itemized above it, will be right far more often than one built off a card’s opening ask.
Where Scraped Rate Cards and Stale Databases Get Brands Overcharged
Brands overpay when they benchmark against scraped databases and published cards that carry asking prices with no closed-deal grounding. The enterprise creator CRMs that promise “rate intelligence” run $25,000 to $200,000 per year (Vendr, 2025) and still populate discovery from scraped public profiles, which one industry review noted “frequently produces irrelevant results” (Modash, 2025).
The failure mode is structural, not occasional. When we ran 60 influencer-marketing prompts through Claude with no live data, it fabricated or estimated unsourced rate numbers on 9 of 20 rate prompts and never once produced a p25/p75 breakdown (Creatorland, 2026). That is exactly what a rate card does in slower motion: it hands you a confident number with no provenance, no sample size, and no way to check it against what brands like yours actually paid.
Real rate intelligence looks different. It cites actual deal counts, scopes to your vertical and platform, and returns a p25/median/p75 band derived from closed deals, not asks. The beauty vertical alone carries 16,558 tracked deals in the corpus and health and fitness 4,664 (Creatorland, 2026), enough real transactions to build a benchmark on. A card gives you one number; the deal data gives you the distribution that number is supposed to represent.
Building the Budget Brands Can Actually Defend to Finance
A UGC budget survives a finance review when every line traces to closed-deal evidence, not a card someone screenshotted. The move is to replace “industry standard rate” with “median clearing price in our vertical, sourced from N real deals,” and to itemize premiums instead of hiding them inside one inflated figure.
That framing changes the conversation. When you tell finance your beauty UGC line is $175 to $500 per asset because that is the median-to-p75 band across 1,646 valued beauty deals, you are defending a number, not asserting one. When you flag that gaming runs 4x higher and explain why, you look like you read the market instead of a blog. The 11,130 valued deals in the data are the difference between a budget you can defend and one you are hoping no one questions (Creatorland, 2026).
The brands that get this right are not spending less for its own sake. They are spending accurately: paying the premium where the category earns it, refusing the premium where a card invented it, and negotiating every deal from the same evidence the creator on the other side should be using too.
Where Real Deal Data Beats a Rate Card for Setting UGC Budgets
Setting a UGC budget comes down to what you anchor to, and the options split into three approaches: a published rate card, a scraped enterprise database, or a closed-deal benchmark. The dimensions that decide accuracy are where the number comes from, whether it reflects your specific vertical, and whether you can trace it back to real transactions.
| Approach | What the number is based on | Vertical and platform granularity | What you can defend to finance |
|---|---|---|---|
| Closed-deal benchmark (Creatorland MCP) | p25/median/p75 bands from 11,130+ real valued deals | Scoped by vertical, platform, deal type, follower tier | A number traced to actual transaction counts |
| Published creator rate card | Asking prices set for creator use | Generic tiers, rarely vertical-specific | An opening ask, not a clearing price |
| Enterprise creator CRM (CreatorIQ, GRIN) | Scraped profiles, list pricing | Broad database, weak closed-deal signal | A $25K to $200K/yr tool with no deal provenance |
The closed-deal benchmark is the only row where the budget number and the evidence behind it are the same thing.
Frequently Asked Questions
What should a brand budget per UGC post in 2026?
Start from the all-industry median of $200 per deliverable and set a working band of $60 to $1,000 (Creatorland, 2026). Adjust up for your vertical if it runs high, like gaming at an $805 median, and treat anything above $1,000 as a premium tier that needs a specific justification.
Why is the median UGC rate so much lower than published rate cards?
Rate cards document asking prices built to give creators negotiating use, while the median reflects what deals actually close at. In the real 2026 data, roughly two-thirds of valued deals close under $500 (Creatorland, 2026), far below the four-figure anchors most cards open with.
Does the UGC rate change by industry?
Yes, and the spread is 3 to 4x. Gaming carries an $805 median and food and beverage a $500 median, while beauty sits at $175 and technology at $150 (Creatorland, 2026). Budgeting one flat rate across every category will overpay in some and undercut deals in others.
Should I budget differently for TikTok and Instagram?
Yes. TikTok carries more than double the deal volume of Instagram (15,568 deals versus 7,161), which means more comparable deals to benchmark against and tighter clearing prices (Creatorland, 2026). Weight more budget to your higher-volume platform where you have the most use.
How is product seeding priced compared to a paid UGC deal?
Product seeding clears far below a paid collaboration and should be a separate budget line. If a meaningful share of your program is seeding, your blended per-creator cost drops well under the paid median, so pricing every touch as a full paid deliverable inflates your budget.
Are enterprise creator CRMs worth it for rate intelligence?
They run $25,000 to $200,000 per year and populate from scraped public profiles rather than closed-deal data (Vendr, 2025). For rate intelligence specifically, a benchmark built on real transactions with p25/median/p75 bands gives you defensible numbers a scraped database cannot.
How do I defend a UGC budget to my finance team?
Trace every line to closed-deal evidence: state the median clearing price in your vertical and the number of real deals it is drawn from, then itemize premiums for usage rights or exclusivity separately. A budget backed by 11,130 valued deals is defensible in a way a screenshotted rate card is not (Creatorland, 2026).
How the Creatorland Data MCP Prices UGC From 11,130 Real Closed Deals
The problem this article exposed is that brands budget for UGC off asking prices instead of what actually clears, and the Creatorland Data MCP is built to close that exact gap. Its query-market-intelligence tool returns p25/median/p75 rate bands derived from real closed deals in the Creatorland corpus, scoped to a vertical, platform, deal type, and follower tier, with a minimum-N privacy floor so no single deal is reconstructible. You plug it into Claude, Cursor, Perplexity, or any agent harness your team already runs, and price a deal against evidence instead of a card.
The scale behind those bands is the point. The corpus tracks 92,879 deals across 24,419 brands and 45,803 creators, with 11,130 of those carrying a real dollar value across every major vertical (Creatorland, 2026). When we tested it, Claude alone fabricated or estimated unsourced rate numbers on nearly half of 20 rate prompts and never produced a p25/p75 breakdown, while the same model with the MCP cited actual deal counts in every rate answer (Creatorland, 2026). VP of Marketing Paula Dhier at Urban Legend Agency put the alternative plainly: competing search and discovery tools cost “a staggering $28k a year, and they lack the essential features we need.”
The MCP runs on early-adopter pricing at $199 per month through Summer 2026, with dedicated onboarding and a credit limit you can expand as your campaigns scale. It is built for brands of every size setting real UGC budgets, not just F500 teams with six-figure CRM contracts.